Restaurant Machine™ The Profit Brain You've Been Missing.
Menu + Sales + Inventory + Labor + Banking — all connected. One system that tells you what to do, not just what happened. The MarginEdge and Restaurant365 alternative built for operators who want action, not dashboards.
Actual vs Theoretical COGS — one click, not spreadsheet forensics
Each module feeds into the next. Update one number, and insights cascade across the entire system. No more siloed spreadsheets or manual reconciliation.
Menu Engine™
Real-time recipe costing. Update vendor prices once — every dish, sauce, and margin updates automatically.
Core Module
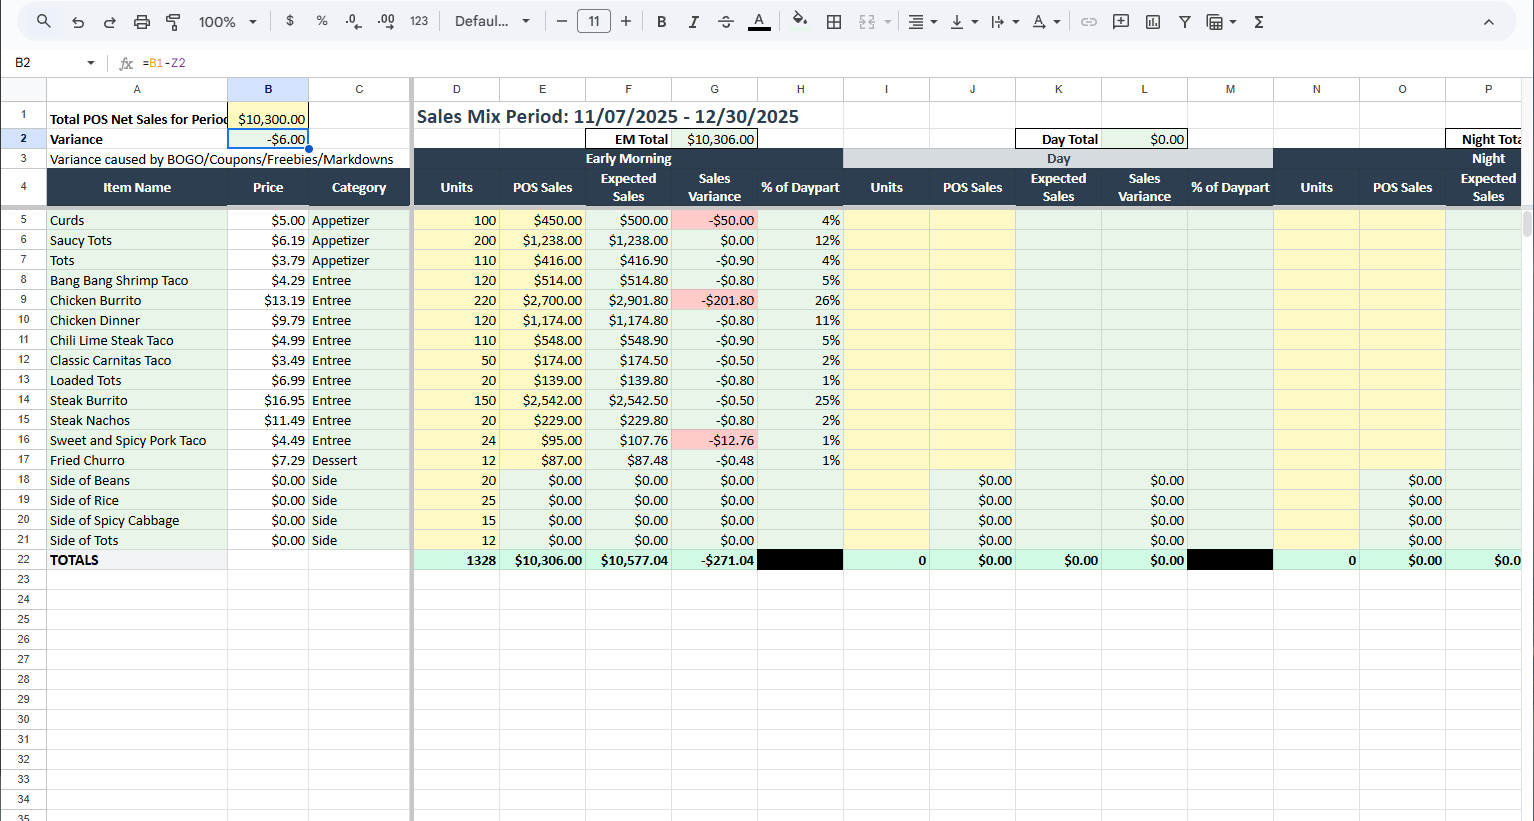
Sales Mix
Track what sells by daypart. Find your stars, plows, puzzles, and dogs. Know which items to push and which to cut.
Generates Insights
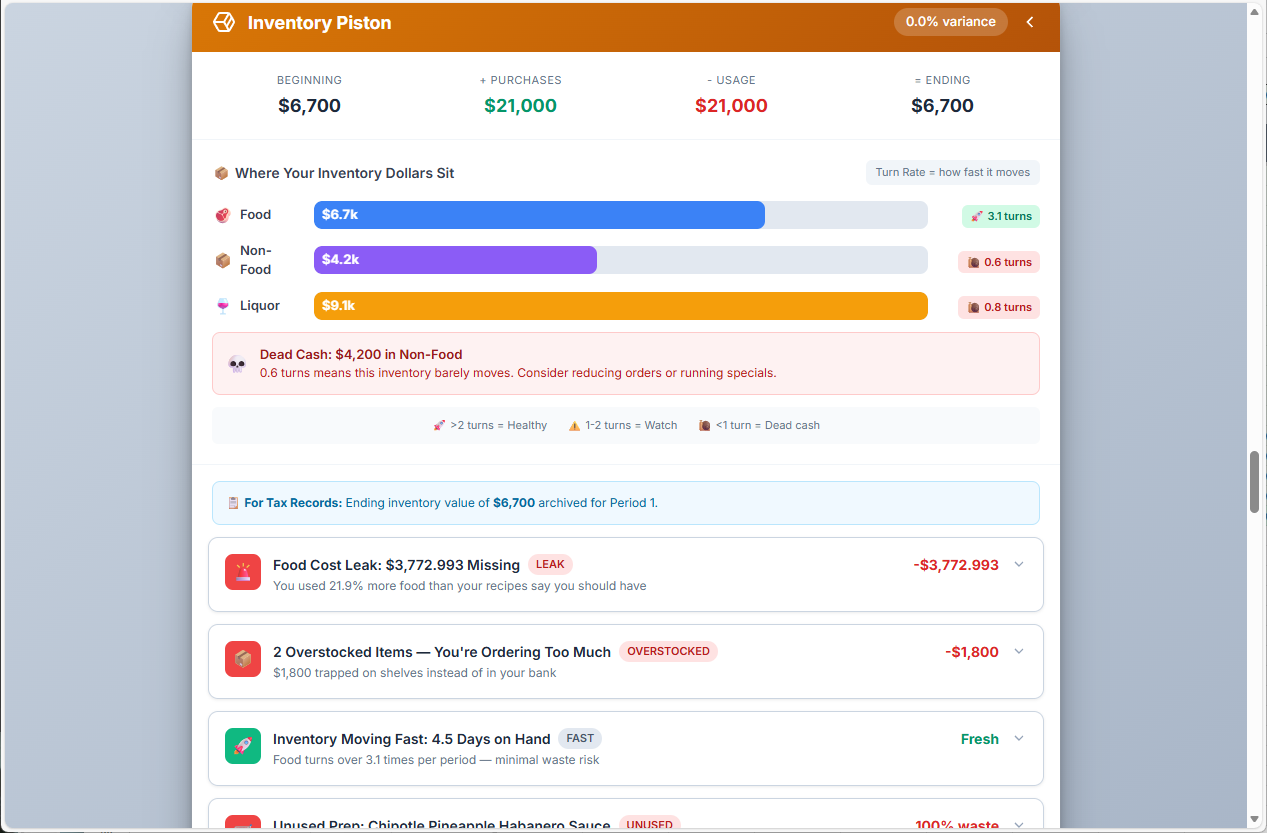
Inventory
3-tier tracking: Food, Non-Food, Liquor. Actual vs Theoretical COGS reveals waste, theft, and portioning issues.
Generates Insights
Labor
Track hours, wages, OT, and benefits by employee. FOH/BOH splits, SPLH by daypart, and overtime alerts.
Generates Insights
Banking & Cashflow
Expense categorization, cash runway calculation, and period burn rate. Know how many weeks you can survive.
Generates Insights
Alcohol
Cocktail and drink costing with pour cost tracking. Separate sales mix for beverage program optimization.
Core Module
See It In Action
Real screenshots from the Restaurant Machine™ system. Click any image to enlarge.
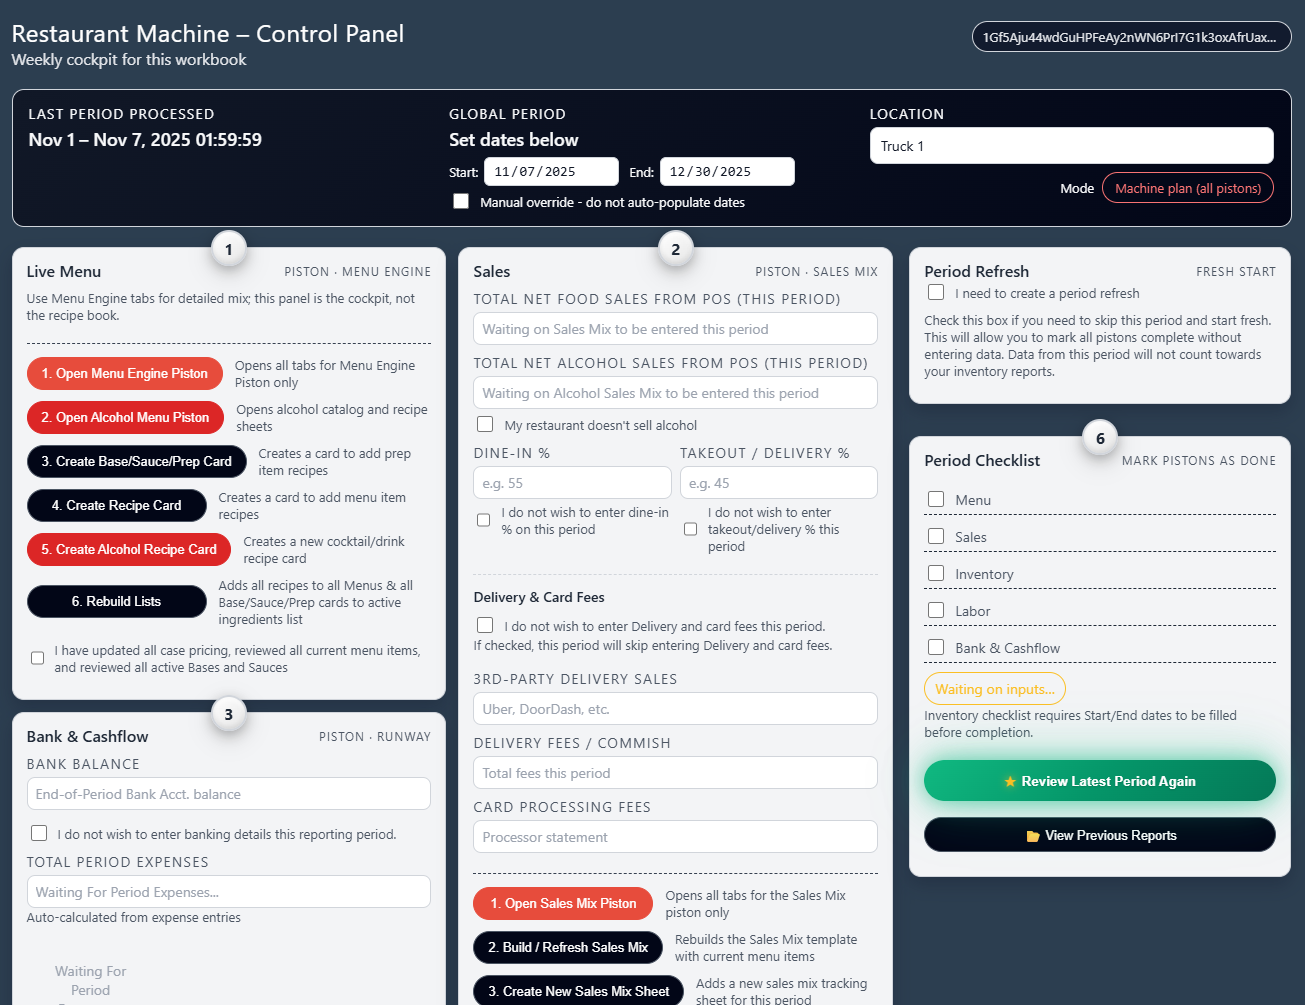
Control Panel
Your command center. Access all 6 pistons, run period reports, and see your current status at a glance.
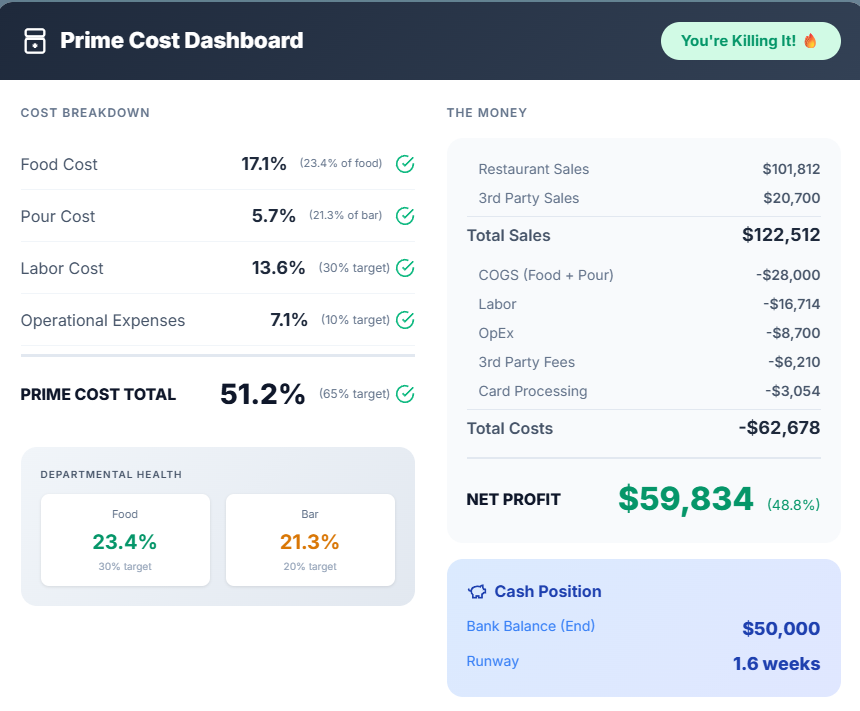
Command Center Report
End-of-period report with prime cost breakdown, menu matrix, and Priority Actions ranked by dollar impact.
Once payment is complete, we'll share your Restaurant Machine file with the email address used at checkout.
To keep everything working correctly, follow these steps exactly:
Open Google Drive.
Click the "+" sign in the top left and create a new folder named "Restaurant Machine".
Click "Shared with me" on the left.
From the file list, right-click the "Restaurant Machine" file, hover over "Organize", and click "Add a shortcut".
Choose the newly created "Restaurant Machine" folder.
Click "Add" in the bottom right.
Click "My Drive" — you will now see a folder with your new Restaurant Machine file located there.
In the future, if you purchase any "Bolt-On" extensions to Restaurant Machine, they will be placed
(via shortcuts) into this same folder so they can be linked together and found when needed.
It is crucial that you do not rename or change the file from the form it was delivered in,
as it may cause some of the live links and background automations to stop working correctly.
How to use your new Restaurant Machine
Step-by-step video walkthroughs for each piston. Videos coming soon — follow the written instructions above to get started.
Videos Coming Soon
Menu & Alcohol Engine
Set up your ingredient catalog, build recipe cards, and connect alcohol costing. Learn how price changes cascade through your entire menu.
Link Coming Soon
Sales Mix & Banking
Import your sales data, track daypart performance, categorize expenses, and calculate your cash runway week by week.
Link Coming Soon
Inventory Piston
Run 3-tier inventory counts (Food, Non-Food, Liquor), track waste logs, and generate Actual vs Theoretical COGS with one click.
Link Coming Soon
Labor & Final Reporting
Enter schedules, track SPLH by daypart, monitor overtime, and generate your Command Center report with Priority Actions.
Link Coming Soon
Not Ready for the Full Machine?
Start smaller and scale when you're ready. Every tier builds on the last.
Free: 10-Minute TuneupQuick diagnostic with our free calculators.Start Free →
$9.99: Stop the Bleed E-BookThe full playbook with SOPs and checklists.Get the E-Book →
$299: Live Menu Engine™Real-time menu costing — the core of the Machine.See Menu Engine →
How is this different from MarginEdge or Restaurant365?
Those platforms show you data. Restaurant Machine™ tells you what to DO with it. Every insight has a dollar amount attached. Plus, you own your data — it's built on Google Sheets, not a proprietary platform.
What if I just need menu costing?
Start with the Live Menu Engine™ ($299 + $10/mo). It's the core of Restaurant Machine™ and works standalone. When you're ready for the full system, it's already built in.
Do I need any special software?
Just Google Sheets (free). The system lives in your Google Drive. No apps to install, no logins to remember, no proprietary platforms.
How long does setup take?
Initial setup takes 2-4 hours depending on your menu size. We provide step-by-step guides and video walkthroughs. Optional 1-on-1 onboarding calls available.
What's the "Command Center Report"?
An end-of-period summary that shows Prime Cost breakdown, Menu Matrix, Labor splits, and Priority Actions. It tells you exactly what to fix and how much you'll save.
Can I try it before buying?
Start with our free 10-Minute Tuneup or the $9.99 E-Book. They use the same frameworks. When you see the results, you'll want the full Machine.
Get Launch Updates
Be first to know when Restaurant Machine™ goes live. Plus weekly tips on cutting costs and boosting profits.
You're in!
Check your inbox for tips and updates from Restaurant Profit Systems.